The release of the NIRF Rankings 2025 has once again placed India’s premier institutions under the national spotlight. While rankings often grab attention for who stands at number one, the real value of NIRF lies in the data behind the ranks. The infographic above, which compares India’s Top 5 universities across salaries, student strength, research funding, and faculty, offers a powerful snapshot of how these institutions differ and why those differences matter.
This article breaks down that infographic in simple English, explains what each metric means, and helps students, parents, and educators understand how to use NIRF data rather than just admire it.
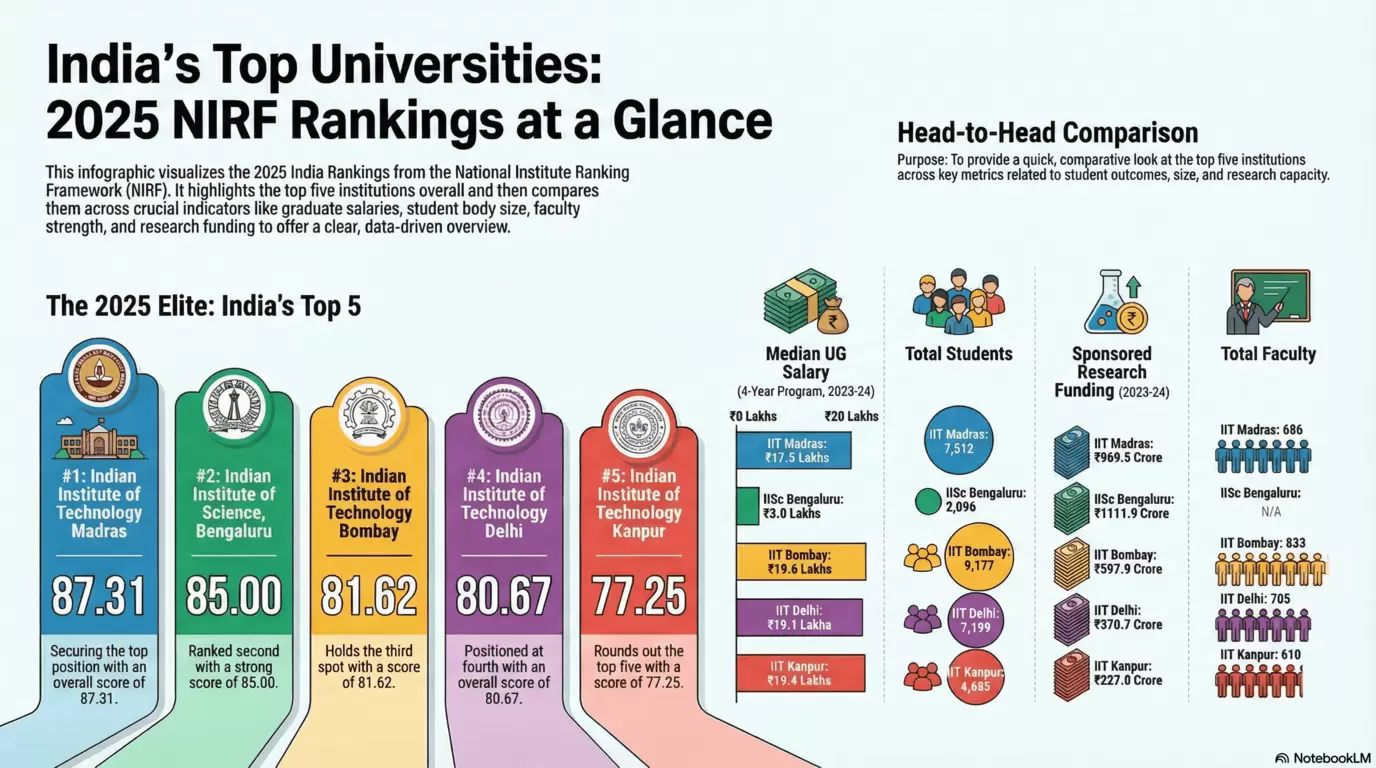
The Top 5 Universities of India: NIRF 2025 at a Glance
According to the infographic, the top five institutions in the Overall category of NIRF 2025 are:
Indian Institute of Technology Madras – Score: 87.31
Indian Institute of Science Bengaluru – Score: 85.00
Indian Institute of Technology Bombay – Score: 81.62
Indian Institute of Technology Delhi – Score: 80.67
Indian Institute of Technology Kanpur – Score: 77.25
At first glance, these scores may appear close, but the infographic makes it clear that each institution reaches the top through different strengths.
Understanding NIRF Beyond the Rank Number
NIRF rankings are not decided by reputation alone. They are calculated using multiple parameters, including:
Teaching quality and resources
Research output and funding
Graduation outcomes (placements and higher studies)
Faculty strength
Public and peer perception
The infographic focuses on four highly student-relevant indicators:
Median undergraduate salary
Total student population
Sponsored research funding
Total faculty strength
Together, these indicators explain why an institution ranks where it does.
Median UG Salary: Do Higher Ranks Mean Higher Pay?
One of the most searched questions around NIRF rankings is about placements. The infographic compares the median salary of students from 4-year undergraduate programs (2023–24).
What the data shows
IIT Bombayleads with a median salary of ₹19.6 lakh
IIT Delhi and IIT Kanpur follow closely at around ₹19–19.4 lakh
IIT Madras reports a median salary of ₹17.5 lakh
IISc Bengaluru, being research-focused, reports a much lower median salary figure
What this really means
A key takeaway is that rank does not equal salary.
IIT Madras ranks first overall but does not have the highest median salary.
IISc Bengaluru ranks second overall despite not being placement-driven at all.
This clearly shows that NIRF rewards overall academic excellence, not just placement packages. Students chasing high-paying corporate jobs should look beyond the overall rank and focus on program-level placement data.
Total Students: Scale vs Selectivity
Another striking comparison in the infographic is student strength.
IIT Bombay has the largest student population among the top five, with 9,177 students
IIT Madras and IIT Delhi have around 7,000–7,500 students
IIT Kanpur has about 4,685 students
IISc Bengaluru stands apart with just 2,096 students
Why this matters
Student population tells us a lot about the learning environment:
Larger campuses offer more diversity, clubs, courses, and peer networks.
Smaller institutions like IISc provide highly focused, mentor-driven education, especially for research students.
Neither model is better for everyone. The infographic makes it clear that India’s top universities follow very different academic philosophies.
Sponsored Research Funding: Where Knowledge Is Being Created
One of the most revealing sections of the infographic is sponsored research funding (2023–24).
The funding leaders
IISc Bengaluru: ₹1,111.9 crore
IIT Madras: ₹969.5 crore
IIT Bombay: ₹597.9 crore
IIT Delhi: ₹370.7 crore
IIT Kanpur: ₹227.0 crore
Why this metric matters
Research funding reflects:
Trust from government and industry
Quality of laboratories and faculty
Long-term contribution to innovation and policy
IISc’s massive lead explains why it consistently ranks at the very top despite its small size. NIRF strongly values research impact, and this metric alone can significantly influence overall rankings.
Faculty Strength: The Human Backbone of Universities
No university can perform well without strong faculty. The infographic compares total faculty numbers:
IIT Bombay: 833 faculty members
IIT Madras: 686
IIT Delhi: 705
IIT Kanpur: 610
IISc Bengaluru: Data not listed in the infographic
What students should note
Faculty numbers, when read along with student strength, indicate:
Faculty–student ratio
Access to mentorship
Quality of academic interaction
Institutes with balanced faculty strength and manageable student numbers usually offer better academic support, especially at postgraduate and research levels.
Why IIT Madras Ranks #1 Overall
The infographic makes one thing clear: IIT Madras may not top every single metric, but it performs strongly across all of them.
High research funding
Strong faculty base
Solid median salaries
Balanced student population
Excellent perception score (reflected in its overall rank)
NIRF rankings reward consistency across parameters, and IIT Madras exemplifies that balance.
IISc Bengaluru: Proof That Research Still Rules
IISc’s position at #2 highlights an important message:
You don’t need massive student numbers or flashy placements to rank at the top—research excellence is enough.
With the highest research funding and a highly selective academic model, IISc represents India’s purest research university. For students aiming for PhDs, global academia, or advanced scientific work, the infographic clearly shows why IISc stands apart.
IIT Bombay, Delhi & Kanpur: Different Paths to the Top
While all three are IITs, the infographic shows subtle differences:
IIT Bombay: Strongest placement outcomes and largest student base
IIT Delhi: Balanced academics with policy and research orientation
IIT Kanpur: High salaries with a more compact, focused campus
These differences matter far more to students than a one-rank difference.
What the Infographic Tells Students (And What It Doesn’t)
What it tells us well
Research strength
Scale of institutions
Placement trends
Faculty capacity
What it does NOT show
Branch-wise placement variation
Teaching style and classroom experience
Hostel life, campus culture, and student support
Individual student performance and effort
That is why rankings should guide shortlisting, not final decisions
How Students Should Use NIRF 2025 Data Smartly
Based on the infographic, here’s a simple rule of thumb:
For high-paying tech jobs → Compare median salaries and IIT-specific data
For research and PhD paths → Focus on IISc and research funding
For overall balance → Look at IIT Madras-style all-rounders
For campus exposure and diversity → Consider student strength and faculty size
The Real Story Behind NIRF 2025
The NIRF 2025 infographic shows that India’s top universities are not carbon copies of each other. Each excels for different reasons—research, teaching scale, placements, or faculty strength.
The most important lesson is this:
A higher rank does not automatically mean a better fit.
Students who understand the data behind the ranks—and match it with their own goals—will always make better academic choices than those who chase numbers alone.
In that sense, NIRF 2025 is not just a ranking list. It is a mirror reflecting how Indian higher education is evolving, and how students can evolve with it.